Incident Tracking - Live Incident Map
Available to Guard and higher roles when the incidentMapAccess feature is enabled for your organization.
Reading the Map
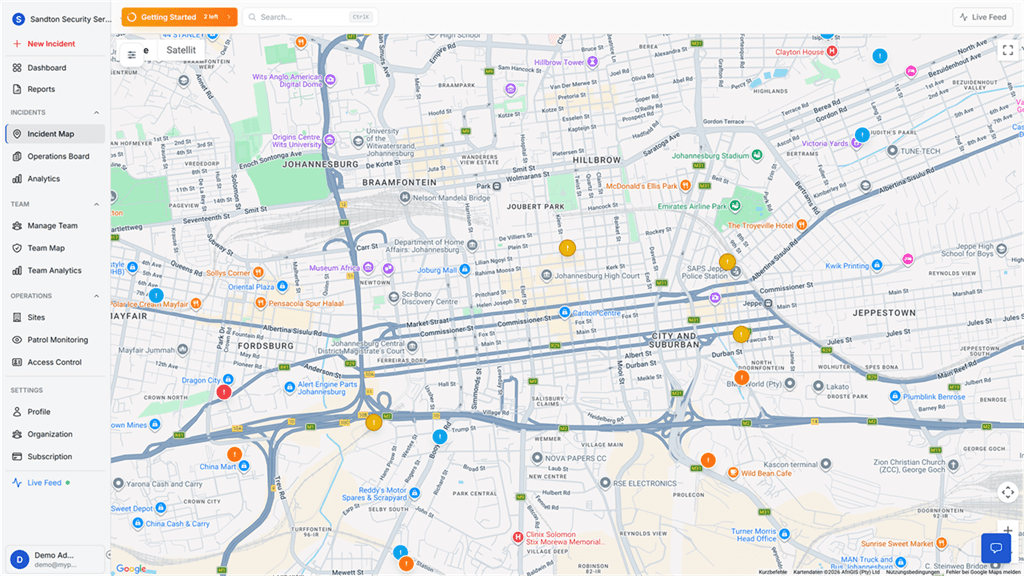
Open Incident Map from the sidebar. The full-screen map loads with colored pins showing every incident in your organization. Each pin color tells you the severity at a glance:
| Pin Color | Severity | Meaning |
|---|---|---|
| Green | Low | Minor or routine matter |
| Yellow | Medium | Non-critical event that needs follow-up |
| Orange | High | Serious incident requiring prompt attention |
| Red | Critical | Emergency demanding immediate response |
The left overlay panel combines live counters, quick filters, and an incident list. This lets you triage current activity without leaving the map.
The screen is organized around two working areas:
 Click to expand
Live Security panel (top left). Shows quick counters for critical incidents, active incidents, resolved incidents in the last 24 hours, and the total incident count.
Map and incident list. The map shows filtered incident pins. The list below the filters shows the first matching incidents with title, severity, reporter, and a short description. Clicking a list item selects that incident on the map.
Filtering by Status
The Status buttons let you show or hide incidents based on where they are in the workflow:
- Active -- Incidents currently being handled. Guards are on scene or the case is being investigated.
- Published -- Incidents that have been shared with clients through the client dashboard.
- All -- Both active and published incidents appear together.
Click any button. The map and the incident list both update immediately.
When to use each filter:
- During a shift, keep it on Active so you only see cases that need attention right now.
- Switch to Published when you need to confirm what client users can already see.
- Use All when reviewing the full operational picture.
Click to expandFiltering by Severity
The Severity chips narrow the map to incidents of a specific urgency:
- Low -- Shows only green pins. Routine matters.
- Medium -- Shows only yellow pins. Follow-up needed but not urgent.
- High -- Shows only orange pins. Requires prompt action.
- Critical -- Shows only red pins. Emergencies.
- All -- Shows every incident regardless of severity.
Practical example: A supervisor starting a night shift can click Critical to immediately see if any emergencies are still open. If the map is clear, they switch to High to review the next tier, then back to All for a complete picture.
Click to expandFiltering by Time Period
The Time buttons control how far back the map reaches:
| Option | Best used for |
|---|---|
| 1h | Real-time monitoring during an active shift |
| 24h | Daily review or shift handover briefing |
| 7d | Weekly pattern review |
| All Time | Full historical view since your organization started using MyProtektor |
If you have applied multiple filters and want to start fresh, click Reset to return to the default view.
Click to expandWorking with the Incident List
The incident list in the overlay panel shows the first matching incidents from your current filters. Each card shows:
- Title: What happened (e.g., "Suspicious Vehicle Near Main Gate").
- Severity tag: Color-coded badge matching the map pin.
- Description: A short summary of the report.
- Reporter: Who logged it.
Click a list item to focus that incident. From the map popup or the detail modal, you can:
- Read the complete description and timeline.
- Add notes or update the status.
- Assign a guard to the case.
- Publish the incident to the client dashboard.
Click to expandClicking a Pin on the Map
Click any colored pin directly on the map to open a quick-view popup. The popup contains:
- Incident Title and Severity -- The name and a color tag showing urgency.
- Description -- A brief summary of what happened.
- Status -- Whether the case is Active, Published, or Resolved.
- Reporter and Time -- Who submitted it and when.
- Three action buttons:
| Button | What it does |
|---|---|
| View Details | Opens the complete incident report with full timeline, notes, and media |
| Edit | Lets you update the description, severity, or status |
| Assign Guard | Opens the guard assignment panel so you can assign the nearest available guard |
This popup is the fastest way to triage an incident. You can read the summary, assign a guard, and close the popup -- all in under 10 seconds.
 Click to expand
Combining Filters for Common Scenarios
Here are filter combinations that match real operational needs:
Shift start briefing: Status = All, Severity = All, Time = 24h. This shows everything from the previous shift.
Active emergency monitoring: Status = Active, Severity = Critical, Time = 1h. Only current emergencies appear.
Weekly client report preparation: Status = Published, Severity = All, Time = 7d. Shows everything the client can already see, making it easy to prepare a summary.
Investigating a specific area: Zoom into the area on the map first, then set Status = All and Time = All Time to see the complete incident history for that location.
What the Incident Map Does NOT Show
- No coverage zone visualization -- the map shows individual incident pins and guard positions, not shaded zones or boundaries
- No heatmap overlay -- there is no density heatmap for incidents
- No geofence boundaries -- the map does not display site perimeters or geofences
Related Solutions
- GPS Tracking Software for Security Guards -- real-time guard positions alongside incident pins
- Real-Time Incident & Emergency Response -- the full incident lifecycle from alert to resolution
- Control Room Dashboard -- one live screen for your entire operation