Dashboard - Your Operations Control Room
Available to authenticated users across the product. Some widgets only appear when related features such as guard tracking, patrol management, or access control are enabled for the organization.
What This Screen Is For
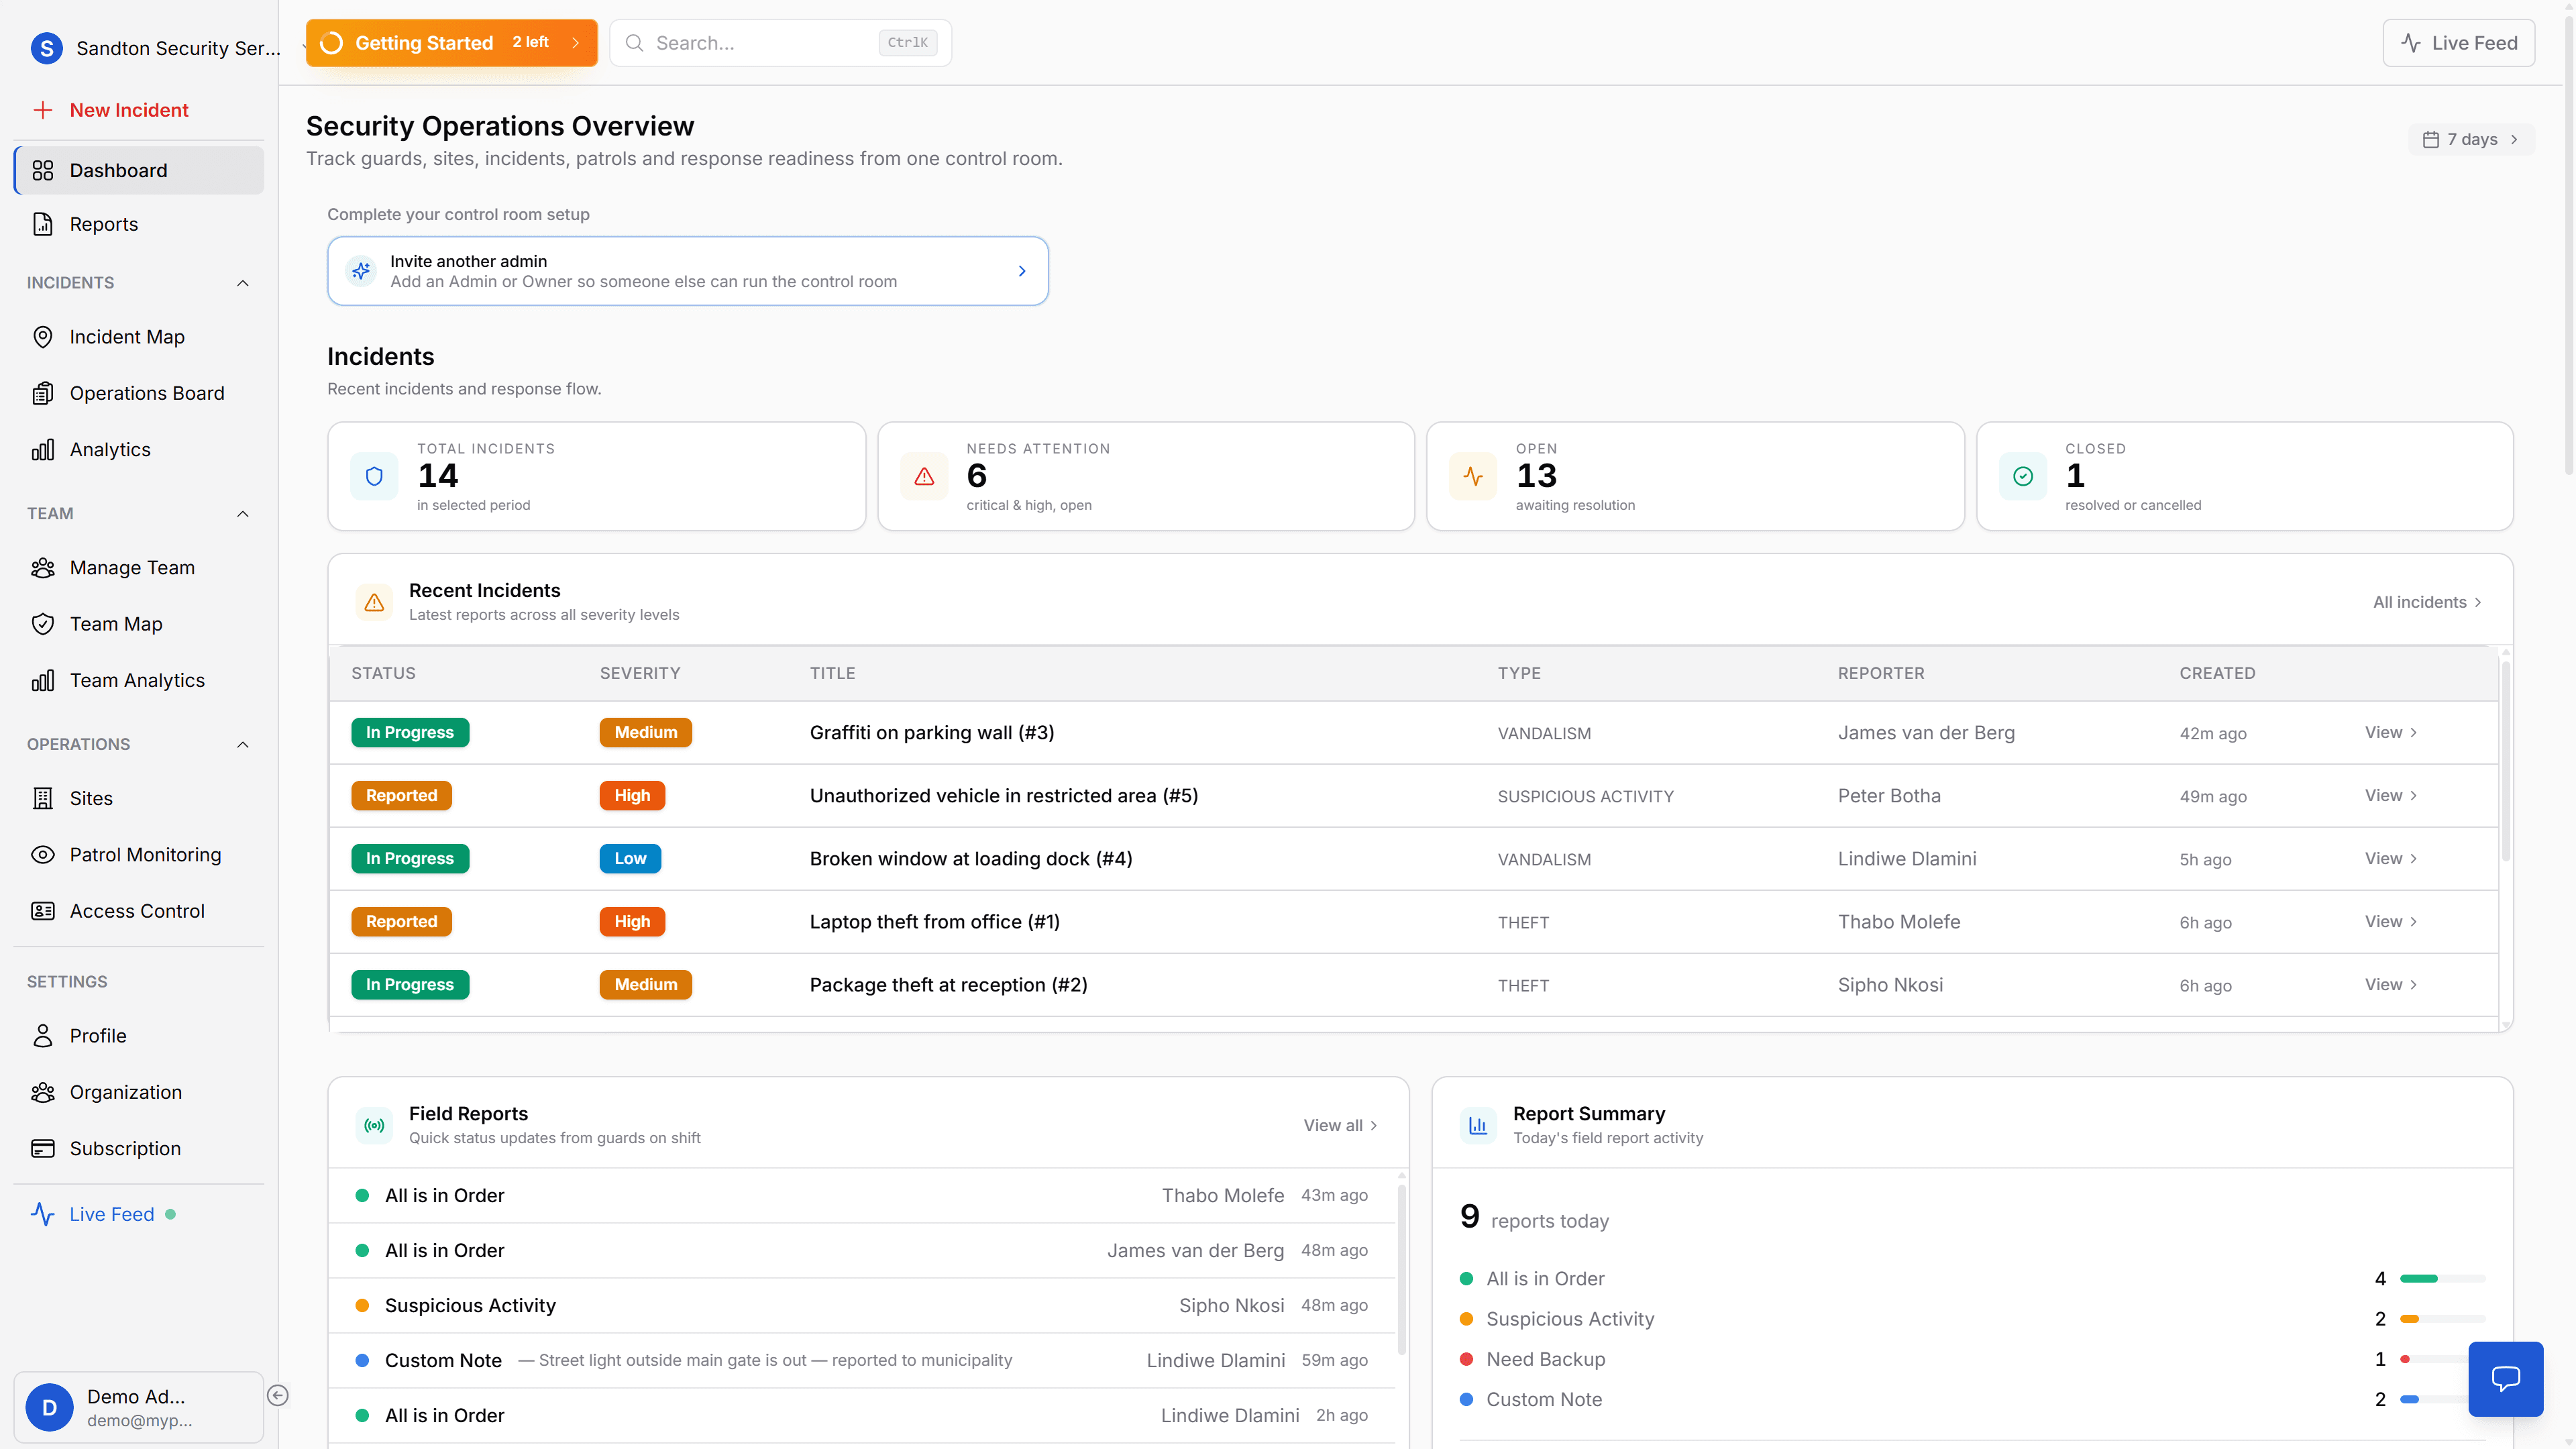
The Dashboard is the control-room overview. It answers the immediate question every operator asks at login: What needs attention right now?
In the current product, the dashboard is built around live operational widgets:
- KPI tiles for incident load
- a recent incidents table
- field reports from guards
- team status
- site overview
- access-control activity
- QR patrol watchlist
If you need charts and trend analysis, use Analytics. The Dashboard is for live operations, not historical reporting.
 Click to expand
Top Controls
At the top of the page, you get:
- the dashboard heading
- a time-range selector
- the setup banner when onboarding tasks are still incomplete
The current time ranges are:
- 24h
- 7d
- 30d
- 90d
- 180d
- 365d
Changing the range updates the KPI strip and dashboard data summaries.
KPI Strip
The four KPI tiles give you a fast incident summary:
| Tile | What it means |
|---|---|
| Total Incidents | All incidents in the selected period |
| Needs Attention | Critical and high-severity incidents still open |
| Open | Incidents awaiting resolution |
| Closed | Incidents resolved or cancelled |
These numbers are there to help you triage. A rising Needs Attention count is usually the first sign that the shift is getting away from the team.
Recent Incidents
The Recent Incidents table is the main operational list on the page. It shows the latest incident records with:
- status
- severity
- title
- type
- reporter
- created time
Use this table when you want the latest case activity without opening the full Operations Board.
The View button opens the incident detail flow so you can inspect the record, update it, assign a guard, or close it.
 Click to expand
Field Reports
When patrol management and ops-log reporting are enabled, the dashboard also shows Field Reports and a Report Summary widget.
These are short operational updates from guards, not full incidents. The current report types are:
- All is in Order
- Suspicious Activity
- Need Backup
- Custom Note
This section is useful during handover because it tells you what guards have been seeing on site, even when those updates did not become full incident cases.
Team and Site Widgets
The lower half of the dashboard gives you a broader operational picture.
Guard Status
This widget shows:
- how many members are on shift
- a small preview of current team status
- role, site, active incident, and last-seen information for the visible rows
Use it to answer a simple question: Who is currently available, and where are they working?
Client Sites
The Client Sites widget lists active sites with patrol-point and overdue context. It is the fastest path into a specific site detail page.
Access Control
The Access Control widget shows the latest gate decisions at a glance. It is a quick summary only. Use the full Access Control page for the complete log.
QR Patrol Checkpoints
The patrol watchlist shows the most urgent checkpoint states first, including overdue points. This is the dashboard shortcut for missed-patrol risk.
Live Feed
The Live Feed is not embedded in the dashboard body. In the current UI, it opens from the Live Feed button in the app shell as a slide-out panel.
That panel gives you:
- live activity counts
- filters for All, Emergency, Incidents, and Operations
- activity cards with direct actions such as Emergency Info, Incident Info, Access Control, or Manage Team
Use the Live Feed when you need the raw event stream across the last 24 hours.
 Click to expand
Working Emergencies from the Dashboard
The dashboard itself does not replace the emergency workflow, but it gives you the fastest route into it:
- Spot the incident in Recent Incidents or open the Live Feed
- Open the incident details
- Review severity, location, and assignment state
- Open the emergency details view when the record is a panic or emergency incident
- Assign a guard manually and monitor progress
Emergency handling in MyProtektor is always operator-led. The platform helps you coordinate it, but it does not auto-assign or auto-dispatch anyone.
 Click to expand
What the Dashboard Does NOT Show
- It does not include the analytics charts, use Analytics for trend and distribution views
- It does not auto-assign the nearest guard
- It does not show coverage zones or gap analysis
- It does not include a separate embedded Live Feed widget in the page body
Recommended Shift Routine
- Start with the KPI strip, especially Needs Attention and Open
- Scan Recent Incidents for anything newly reported or still unassigned
- Check Field Reports for guard-side context that may not yet be a full case
- Review Guard Status and Client Sites
- Open Live Feed when you need the last 24-hour event stream
- Move into Operations Board, Incident Map, or Team Map when the shift requires deeper action
Related Solutions
- Control Room Dashboard - the broader operational view this page supports
- Emergency Response - how incidents move from alert to assignment and resolution
- Guard Tracking - how live team visibility connects to dashboard operations