Admin Manual – Dashboard Tab
1. Dashboard Overview
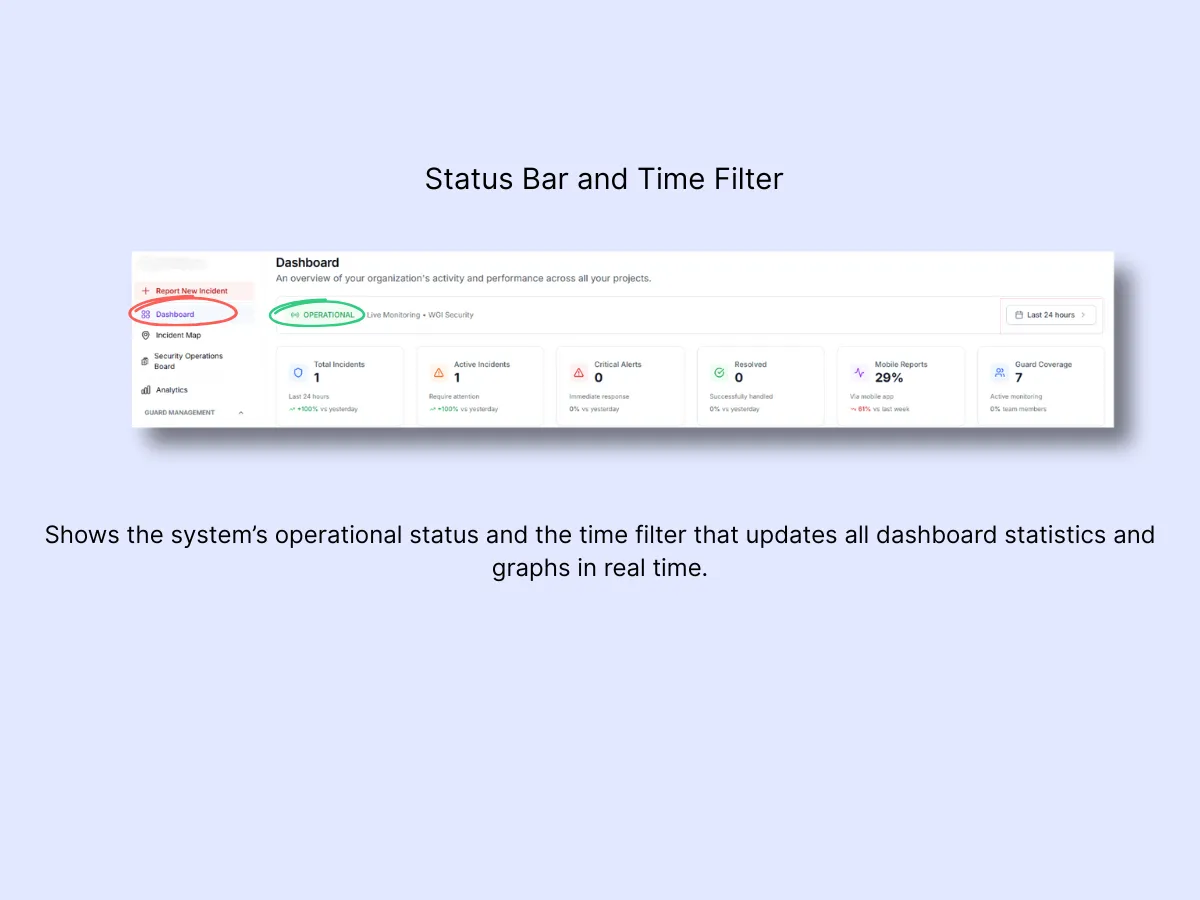
A. Status Bar (Top)
- Indicates whether your system is Operational or experiencing an issue.
- Refreshes automatically in real time.
- You can also filter incidents across various time ranges:
- Last 24 hours
- Last 7 days
- Last 30 days
- Adjusting this filter will update all dashboard metrics and charts for streamlined trend analysis.
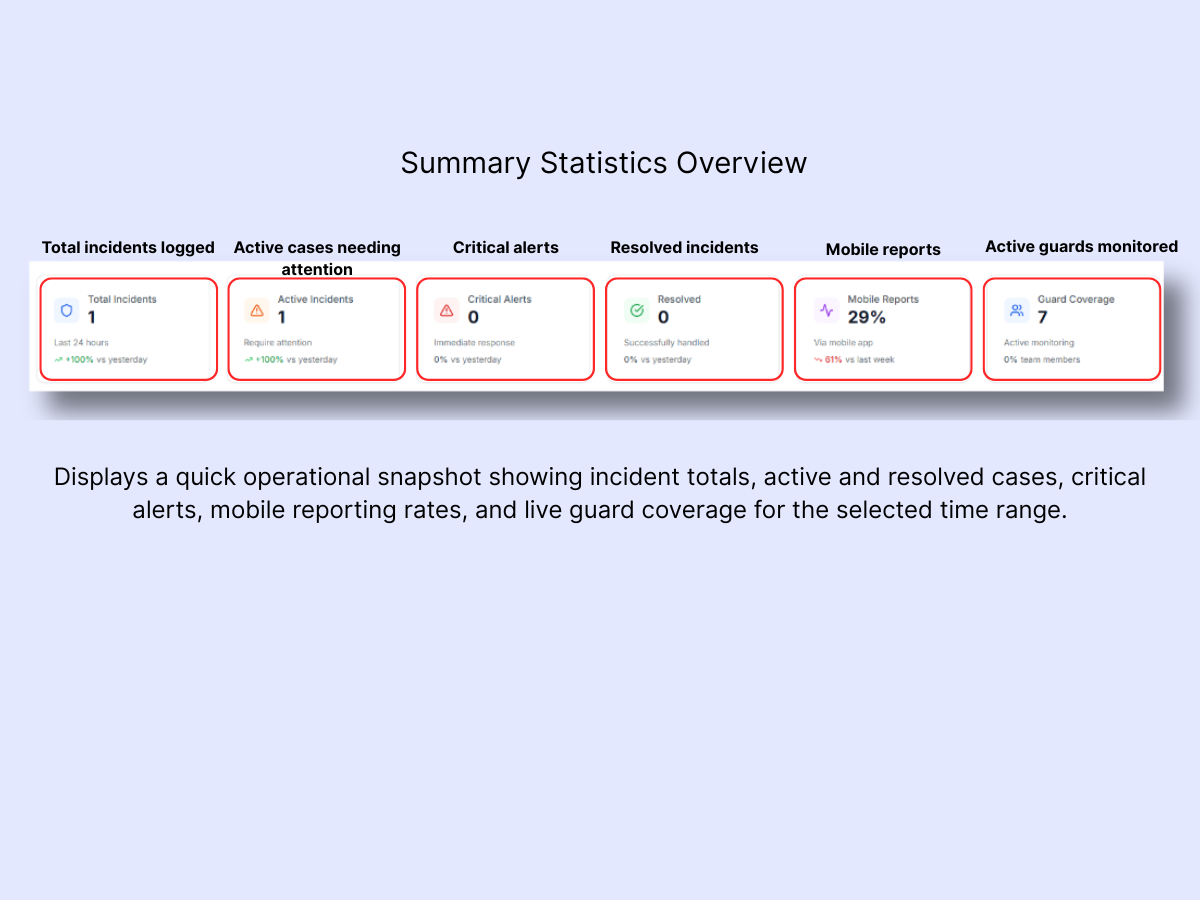
B. Summary Stats (Top Row)
Each tile provides an at-a-glance overview:
- Total Incidents: the count of incidents within your chosen time range.
- Active Incidents: open cases that still need action.
- Critical Alerts: high-priority, urgent incidents.
- Resolved: incidents that have been successfully closed out.
- Mobile Reports: percentage of incidents submitted through the guard mobile app.
- Guard Coverage: total number of guards currently being monitored.
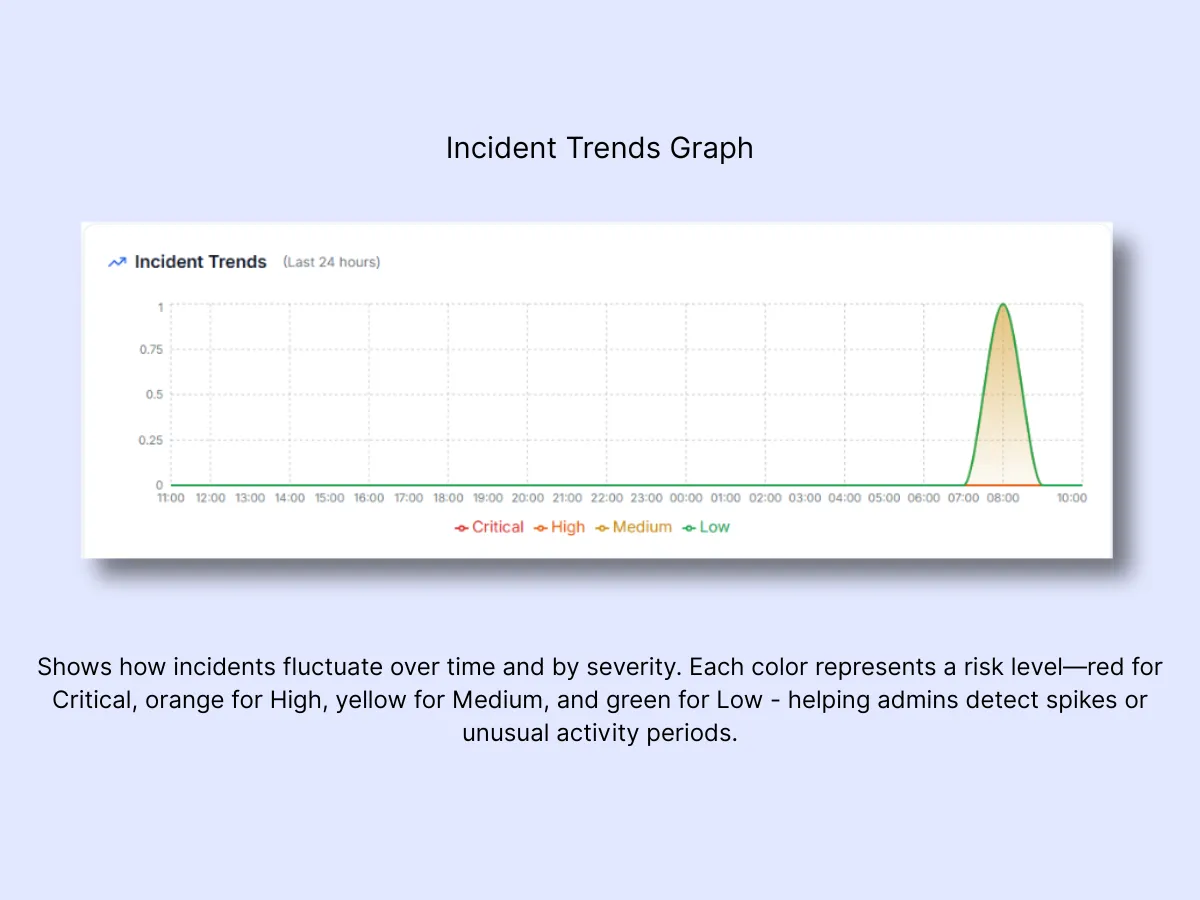
C. Incident Trends Graph
- Visualizes incident patterns across the selected period.
- Lines are color-coded by severity:
- Red = Critical
- Orange = High
- Yellow = Medium
- Green = Low
- Useful for identifying activity spikes during particular shifts or days.
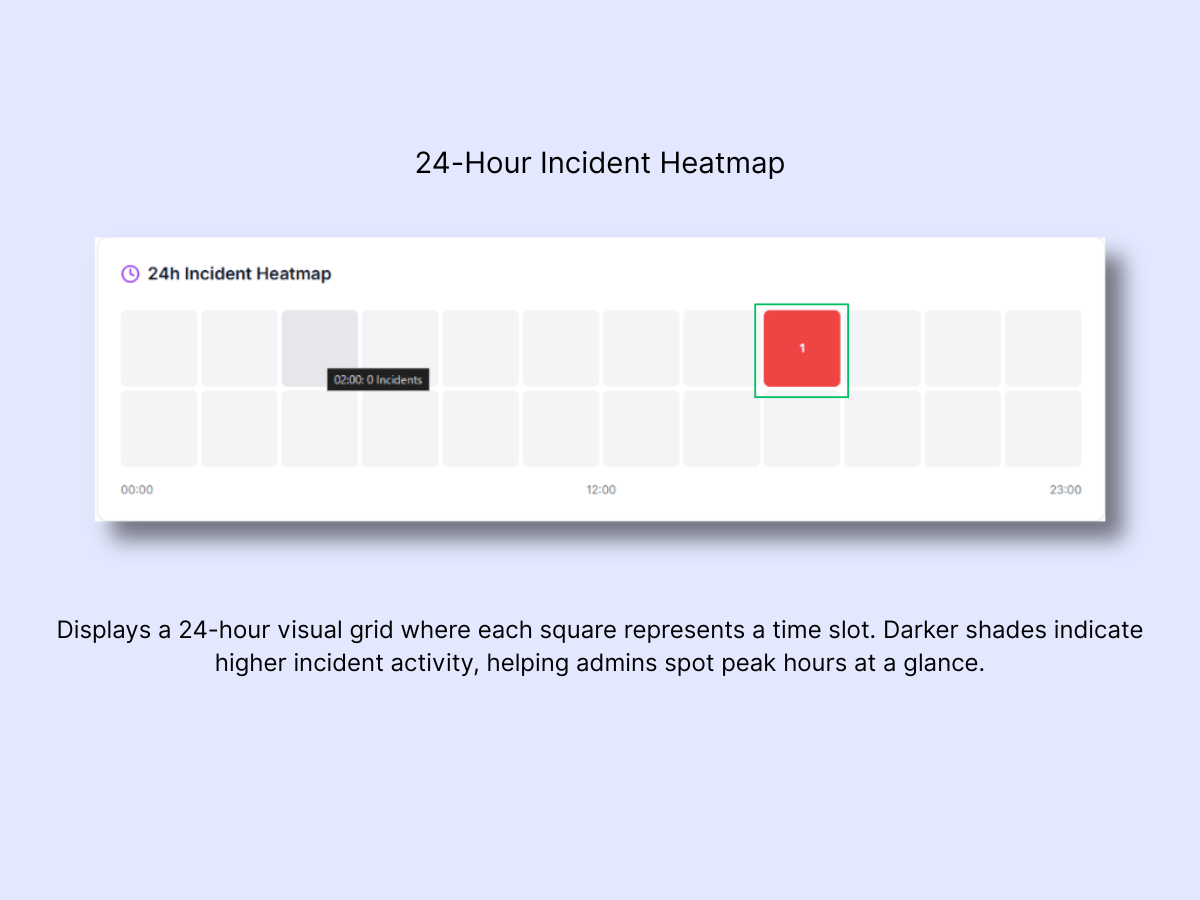
D. 24h Incident Heatmap
- A visual grid representing incidents over the past 24 hours.
- Each cell corresponds to a specific time slot.
- Deeper colors (red) indicate higher-activity periods.
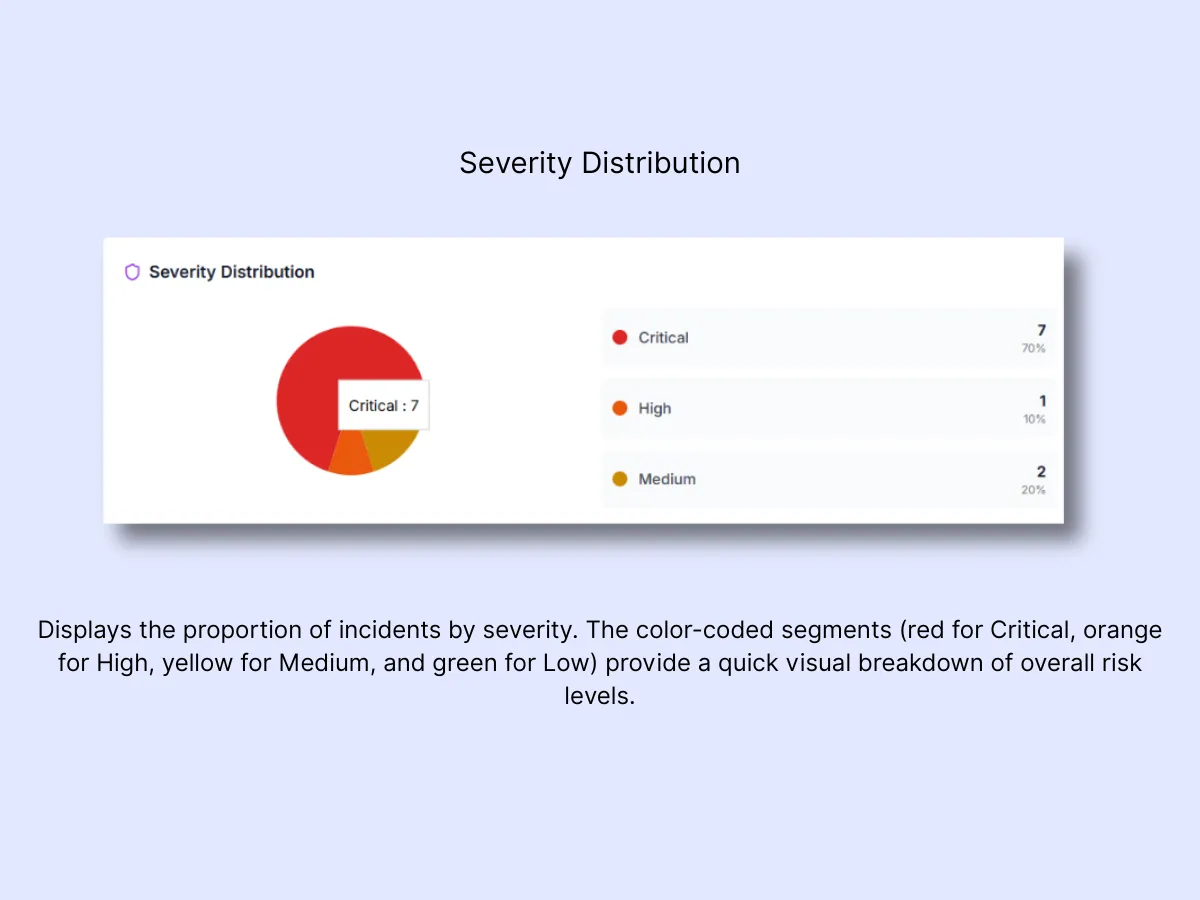
E. Severity Distribution
- A pie chart illustrating the breakdown of incidents by severity level.
- Gives you a fast view of how many incidents fall under Critical vs Medium vs Low.
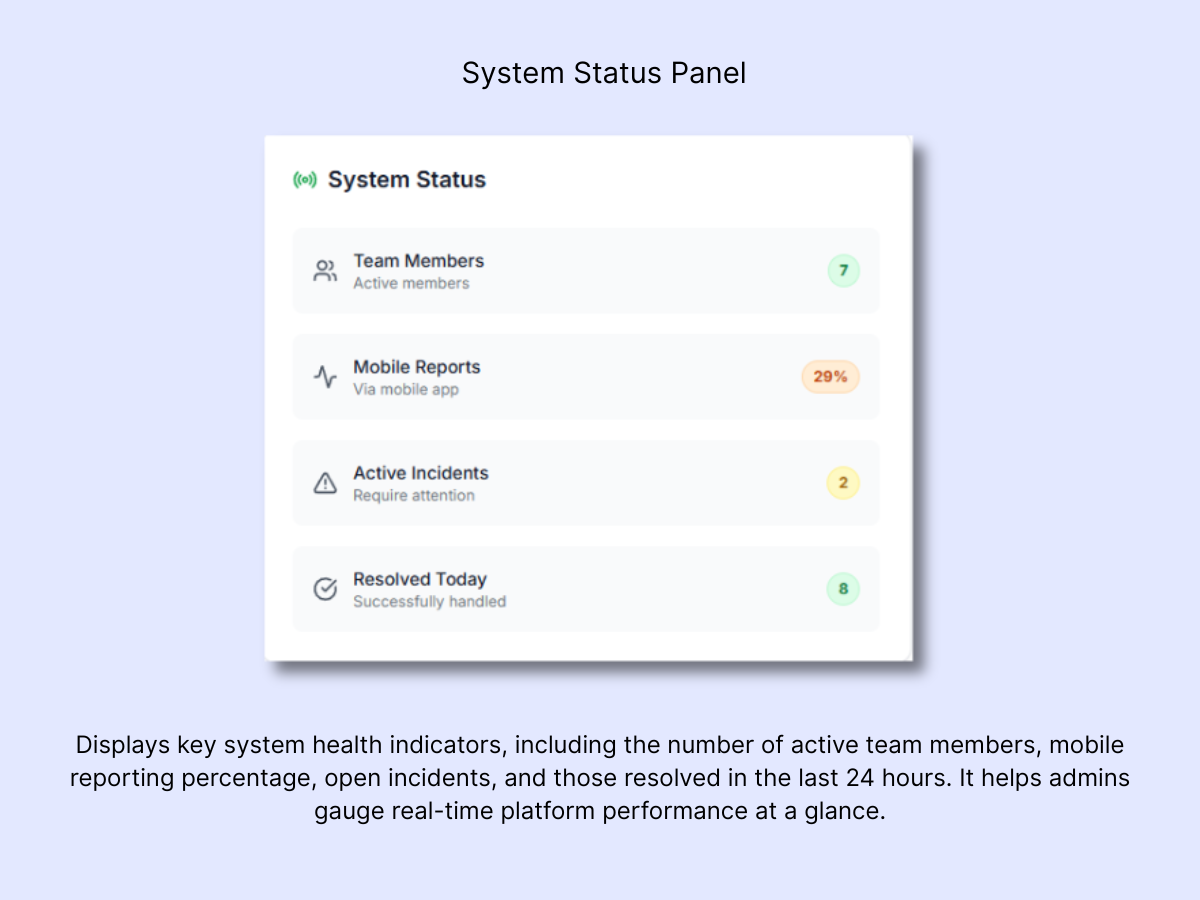
F. System Status
Found in the bottom-right corner, this panel displays:
- Team Members: count of active guards and admins.
- Mobile Reports: proportion of reports originating from the mobile app.
- Active Incidents: currently open cases.
- Resolved Today: incidents addressed within the last 24 hours.
2. Live Activity Feed
The Live Activity Feed is the most essential section of the Dashboard. Every guard-reported incident surfaces here in real time.
Incident Cards
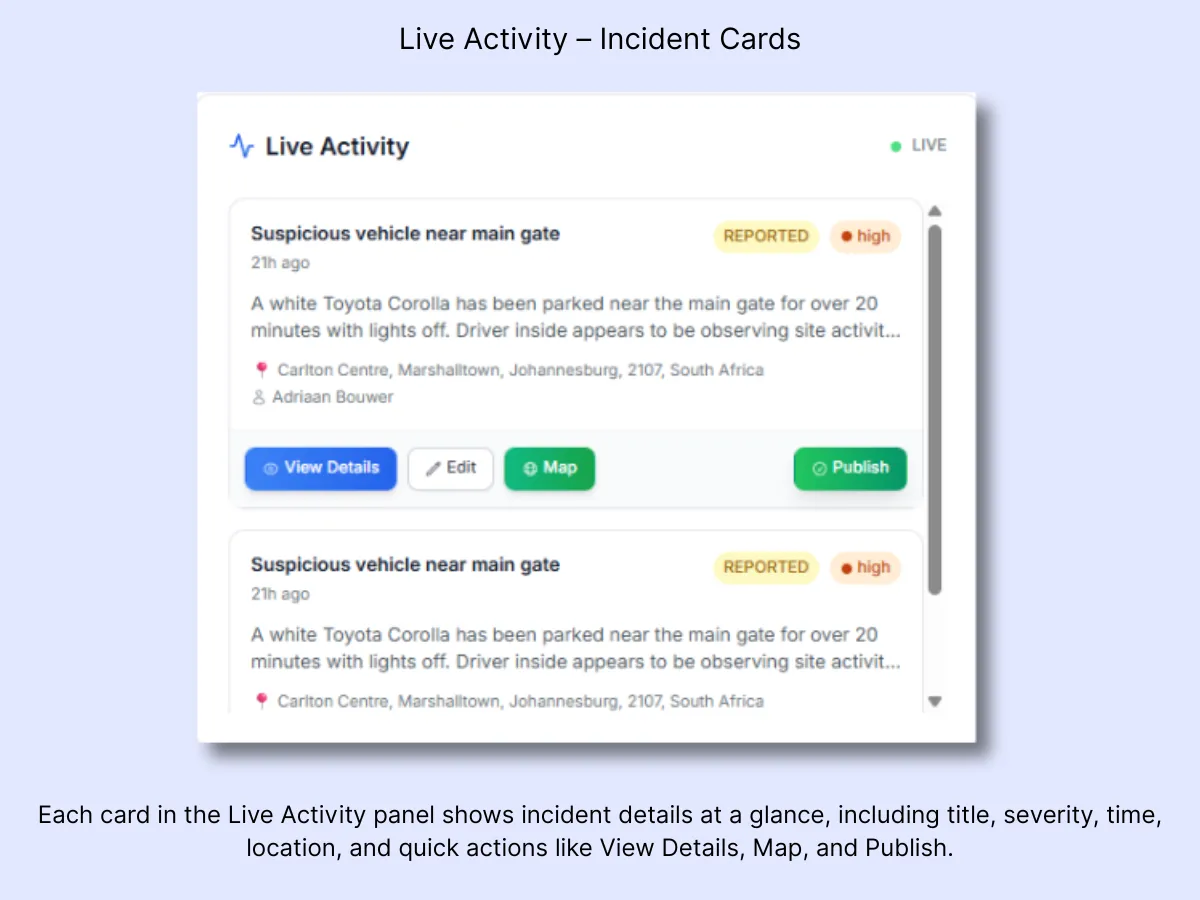
Every incident card includes:
- Title & Description (e.g. Car crashed)
- Time reported
- Reporter (guard name)
- Severity level (Low, Medium, High, Critical)
- Location (address & GPS pin)
- Status (Reported, Published, Resolved)
At the bottom of each card, you will find action buttons:View Details | Edit | Map | Publish
Note: When a panic button is triggered, the card will be highlighted in red as an Emergency Alert Card carrying a Priority Response label and an additional button: All Emergency Details.
The following sections describe what each option does and how to use it.
A. All Emergency Details (Panic Alerts Only)
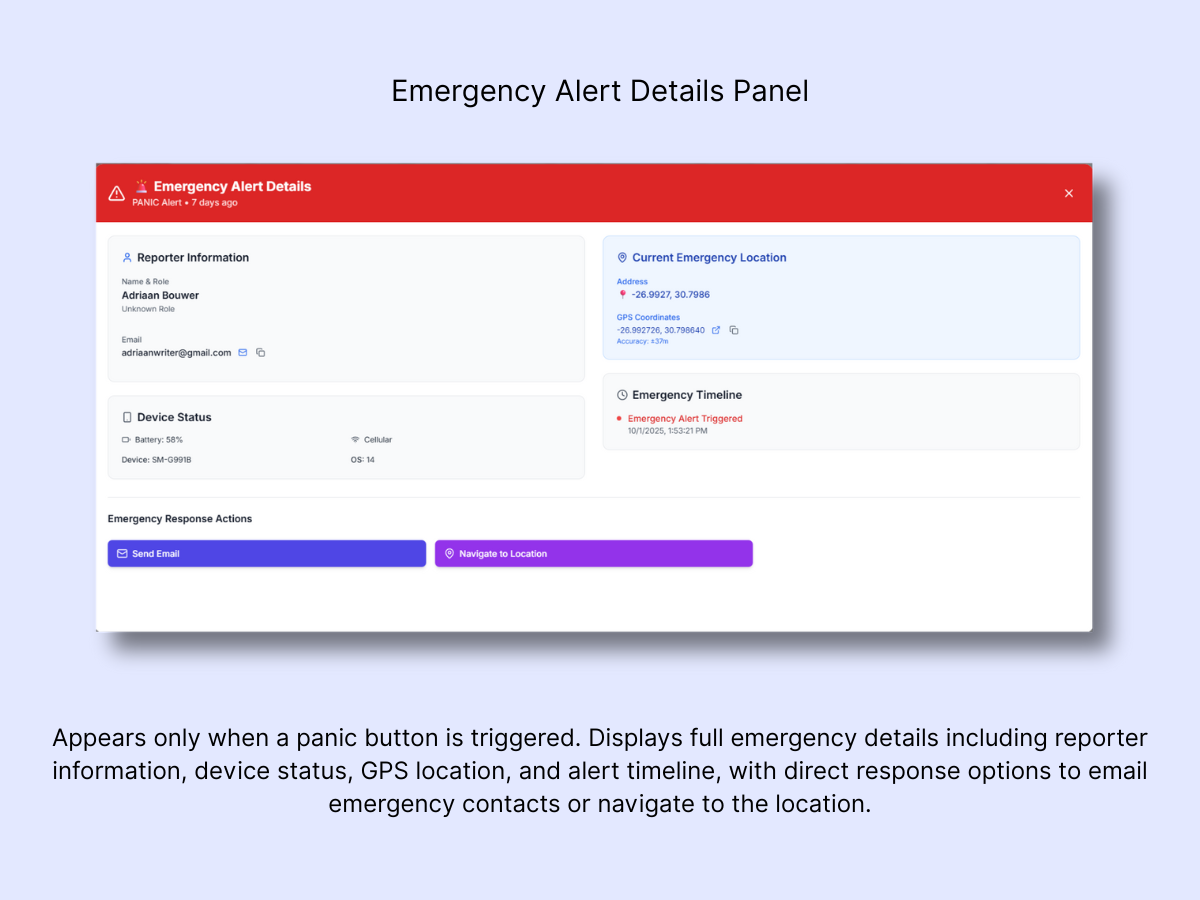
Important: This option is not available for all incidents. It only surfaces when a panic button has been activated.
- Opens a dedicated emergency alert panel containing:
- Reporter Info: guard name, role, email
- Device Status: battery %, device type, OS, Wi-Fi/Signal
- Current Location: address + GPS coordinates (with accuracy margin)
- Emergency Timeline: precise time the panic alert was triggered
Response actions available:
- Send Email: immediately notify emergency contacts
- Navigate to Location: launch directions for response teams
B. View Details
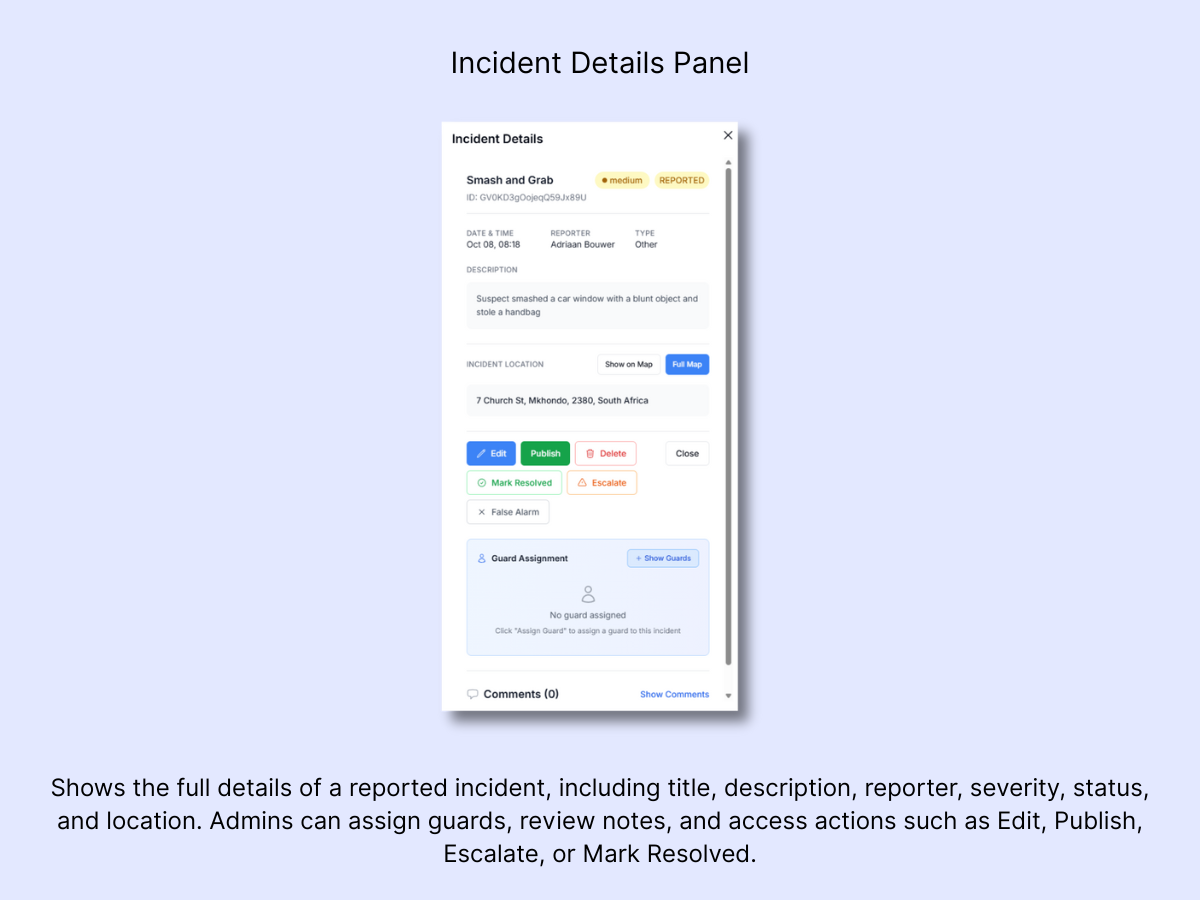
This is the standard view for most reported incidents (patrol reports, thefts, accidents, etc.). Emergency alerts also include this option alongside All Emergency Details.
Displays:
- Title, description, reporter, date & time
- Incident type (Accident, Theft, Emergency, Patrol Breach, etc.)
- Severity & status (Reported, Resolved, Escalated, False Alarm)
- Location with map preview
- Guard assignment panel (assign a guard if one hasn't been assigned yet)
- Comment thread for admin guard notes
Available actions:
- Edit: modify severity, description, or type
- Publish: share the incident to the client portal
- Delete: remove from the system
- Mark Resolved: officially close the incident
- Escalate: raise to management/emergenc
- False Alarm: dismiss when no threat is confirmed
C. Edit
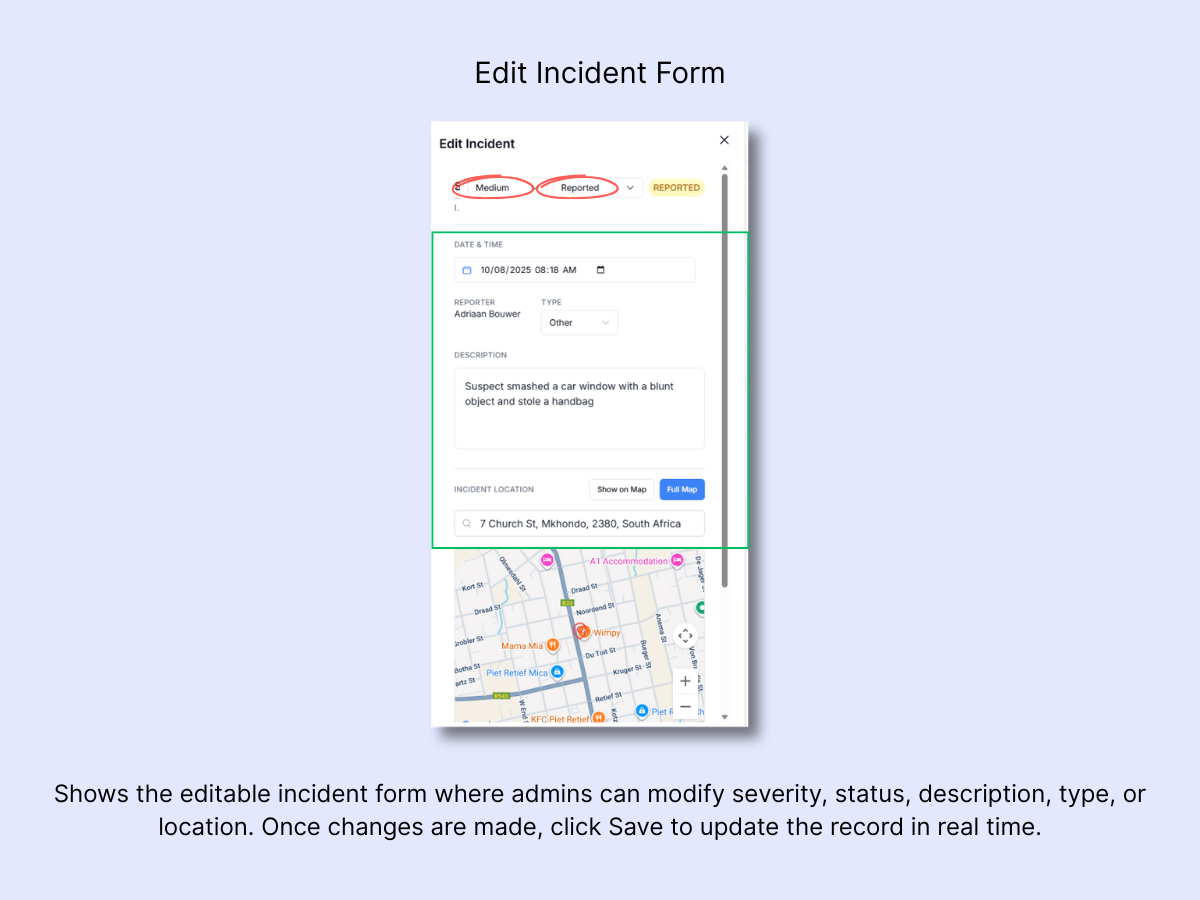
Click Edit to modify the incident record.
- Fields available for editing:
- Severity (Low → Critical)
- Status (Reported → Resolved)
- Description
- Type (Accident, Patrol Breach, Emergency, Theft, etc.)
- Location (adjust GPS pin/address)
- Save when finished.
D. Map View
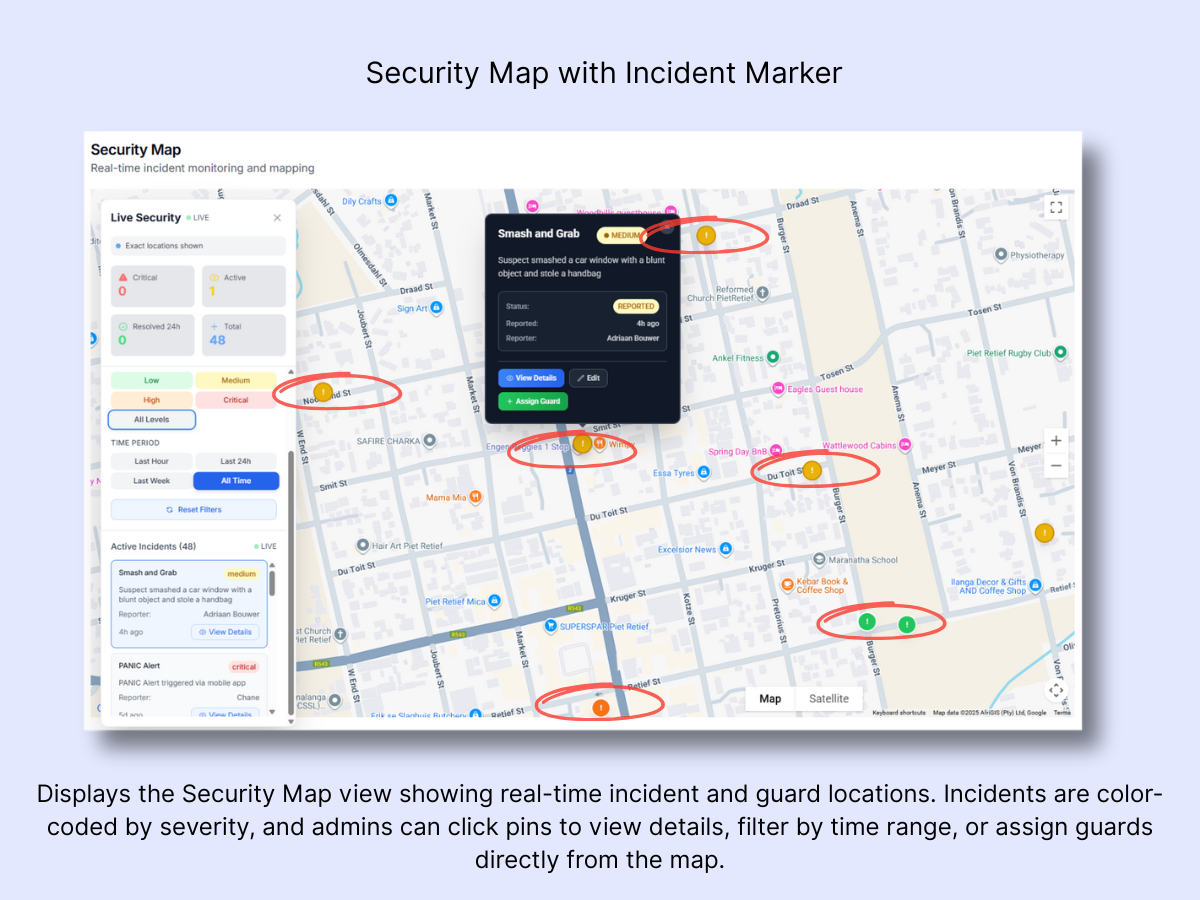
Click Map to launch the Security Map.
Features:
- Incident pins color-coded according to severity
- Guard positions displayed in real time
- Filter incidents by severity & time range (Last Hour, 24h, 7d, All Time)
Actions:
- Click any pin to review its details
- Assign a guard directly from the map
E. Publish
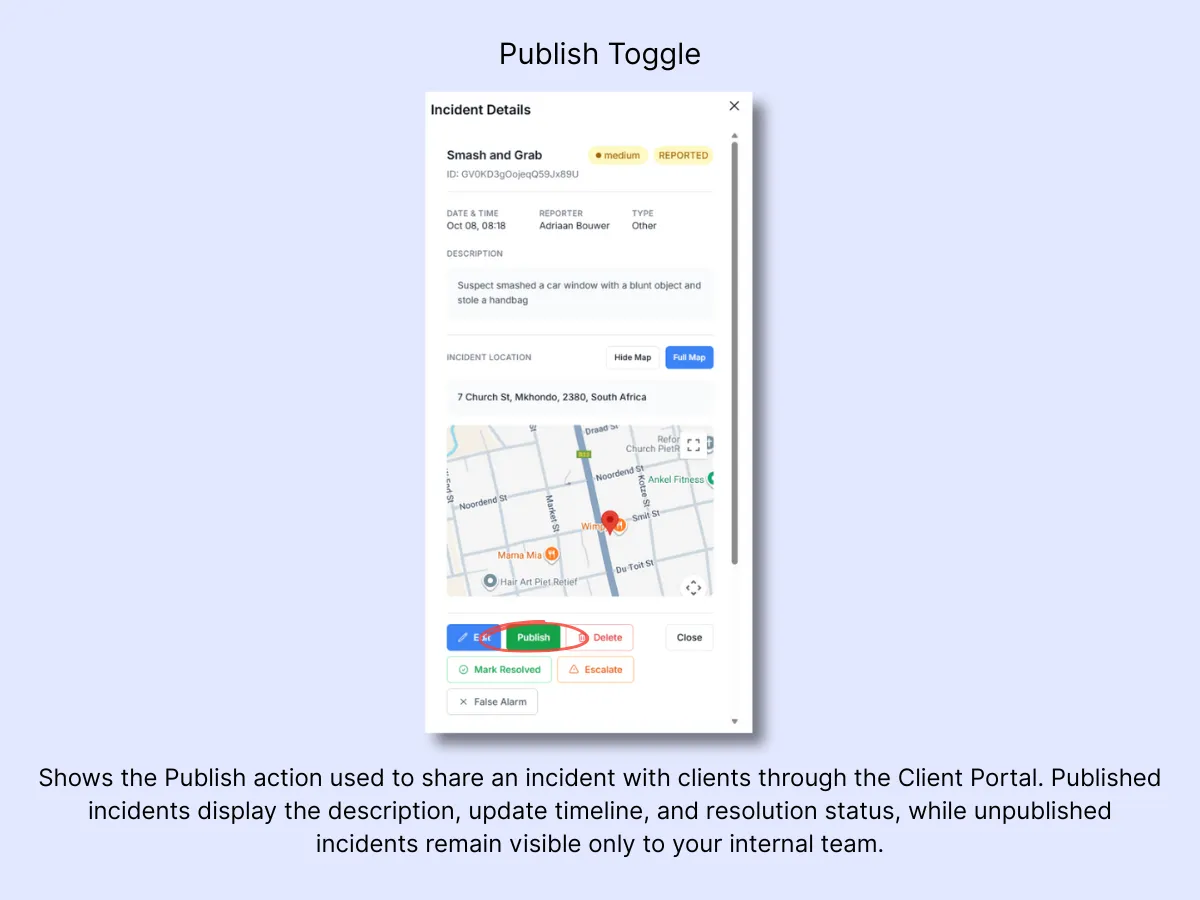
Click Publish to make the incident visible to clients through the Client Portal.
Published incidents display:
- Incident description
- Timeline of updates
- Resolution status
If left unpublished, the incident stays internal to your team only.
3. Typical Admin Workflow
- A guard submits "Car crashed at Gate 2" from the mobile app.
- The admin sees it appear in Live Activity (medium severity).
- The admin clicks View Details to review the description, reporter, and time.
- The admin clicks Map to verify the GPS location and identify the nearest guard.
- The admin assigns a guard from the map panel.
- The admin clicks Publish to keep the client informed.
- Once the situation is handled, the admin clicks Mark Resolved.
For panic button emergencies, the admin can also click All Emergency Details to review device status, battery level, and the event timeline before dispatching a response.
Every action is timestamped and logged for compliance purposes.
Quick Tip: Make Live Activity your first stop when you log in. It highlights what is happening right now and what needs your immediate attention. When you are not actively working in other features, we recommend keeping the Dashboard screen open so you can respond without delay to new incidents or emergencies.
Related Solutions
- Control Room Dashboard — the full real-time command view for your operation
- Real-Time Incident & Emergency Response — how incidents flow from report to resolution
- Mobile App with Panic Alerts — how guards and clients trigger emergency alerts