Admin Manual - Incident Map
Overview
- Live Security Map: Shows all active, resolved, and published incidents in real time using severity-based color pins.
- Status Filters: Switch between Active, Published, and All to control what appears on the map.
- Severity Levels: Select from Low, Medium, High, or Critical incidents to sharpen prioritization.
- Time Period: Narrow incidents by Last Hour, Last 24h, Last Week, or All Time.
- Incident Feed: Lists every active report with direct access to View Details.
- Guard Locations: Displays where each guard is currently positioned or responding.
- Map Controls: Zoom, pan, or toggle between Map and Satellite view for improved situational awareness.
Use Case
An admin relies on the Incident Map to coordinate responses across multiple sites. For instance, when a "Smash and Grab" alert surfaces on the map, the admin filters by "High" severity, clicks the incident pin to review the details, and checks which guards are closest.
With a single click, they dispatch the nearest available guard, monitor the response in progress, and later mark the case as "Resolved." This approach ensures faster action and complete visibility without the need to switch between screens.
Step-by-Step Instructions
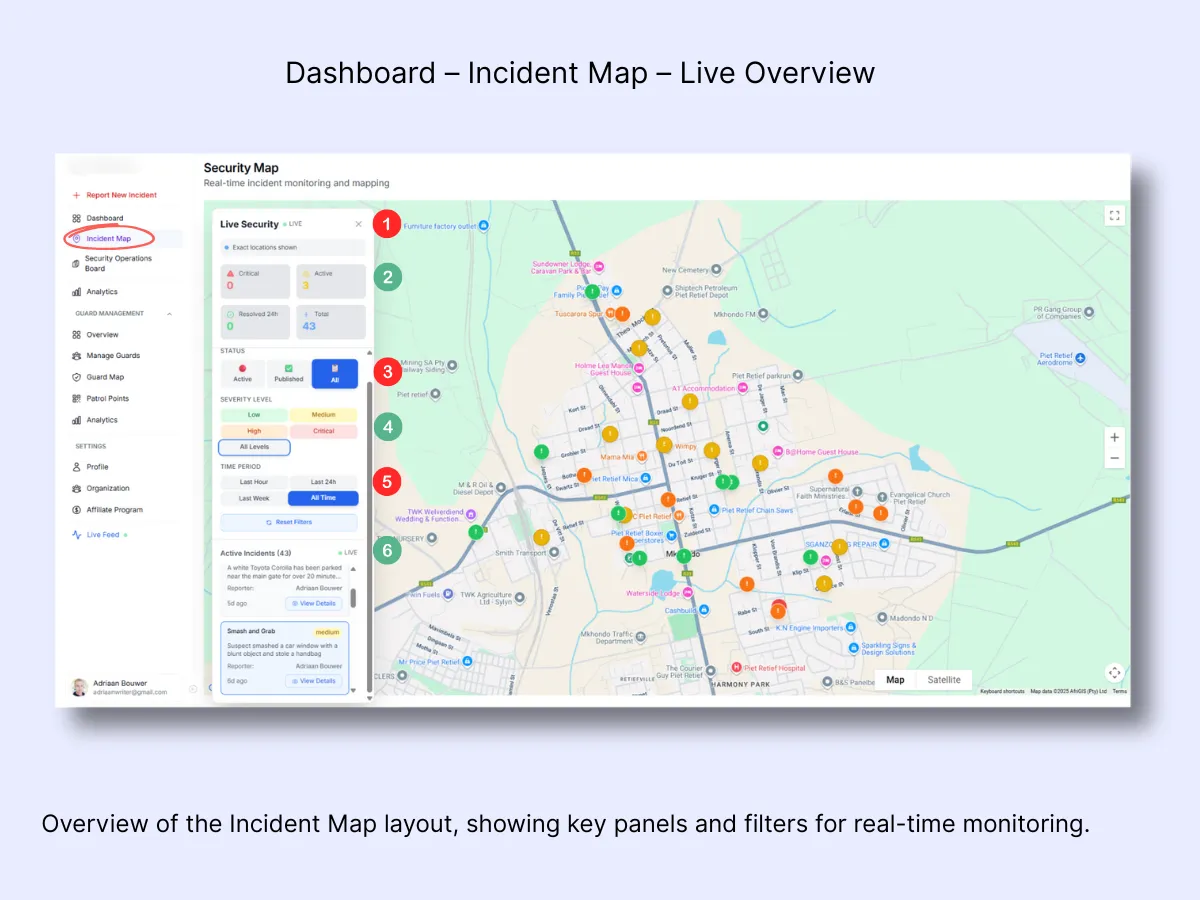
Step 1 – Open the Incident Map and Review the Interface
From the left sidebar, select Incident Map to launch the live map view. The dashboard will present all current and historical incidents using color-coded pins. Use this screen to track activity, assess severity levels, and access detailed reports.
Here is what each element represents:
- Live Security Panel: Shows live status and lets you confirm that guard and incident positions are accurately displayed.
- Incident Counters: At-a-glance stats covering total, active, critical, and resolved incidents.
- Status Filters: Switch between Active, Published, or All to tailor your view.
- Severity Level: Filter by Low, Medium, High, or Critical incidents.
- Time Period: Limit your results to the last hour, day, week, or all time.
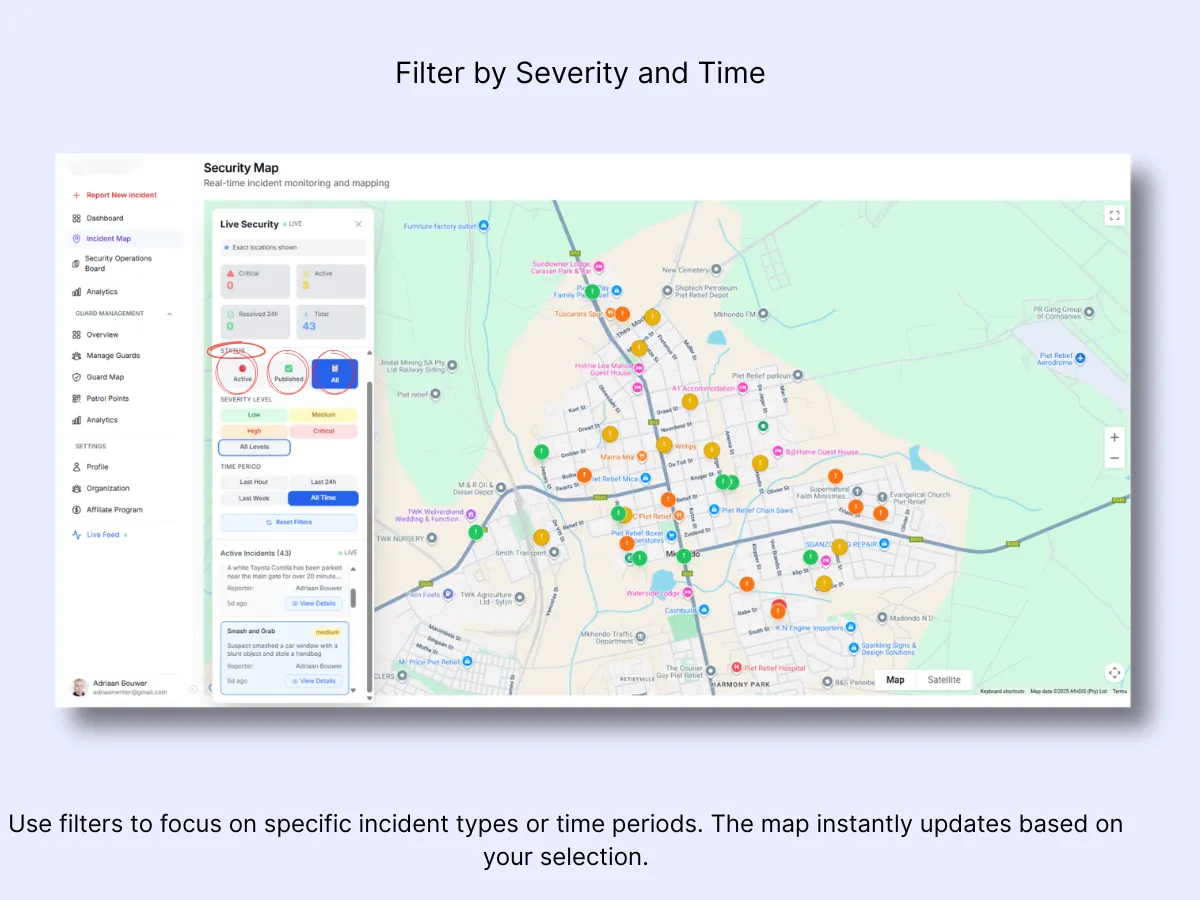
Step 2 – Use Status Filters to Control What You See
The Status filter determines which incidents are shown on the map. Your options are:
- Active: Displays incidents currently being handled by guards.
- Published: Shows incidents that have been shared with clients through the Client Portal.
- All: Merges both views for a comprehensive look at ongoing and shared activity.
Changing filters instantly refreshes the map and the accompanying list, allowing you to concentrate on the most relevant operations without leaving the screen.
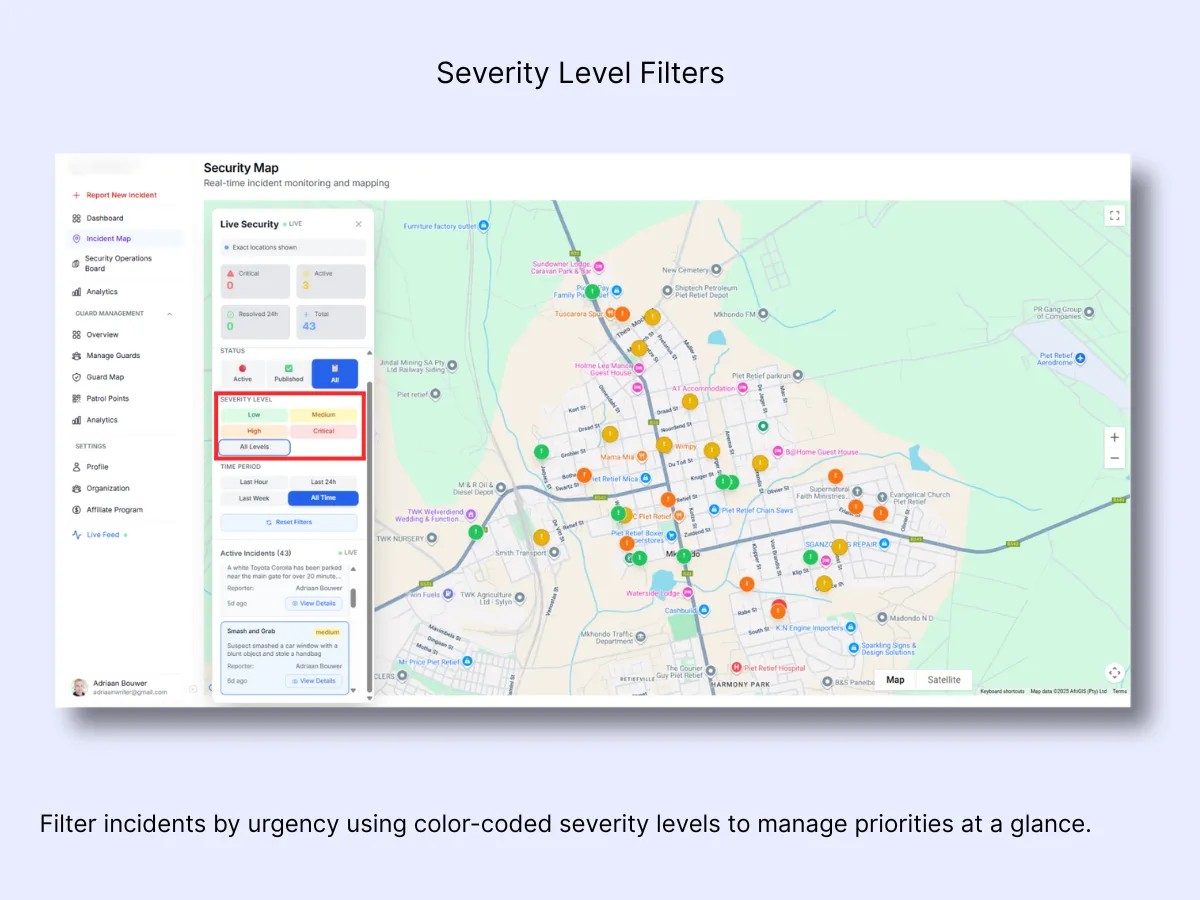
Step 3 – Filter Incidents by Severity Level
Apply the Severity Level filter to prioritize incidents according to urgency. Each level is color-coded on both the map and the list for quick identification:
- Low (Green): Minor or routine matters.
- Medium (Yellow): Non-critical events that still warrant follow-up.
- High (Orange): Serious incidents requiring prompt attention.
- Critical (Red): Emergencies demanding an immediate response.
- All Levels: Displays every incident regardless of severity.
Choosing a level refreshes the map to show only incidents matching that priority, enabling admins to direct their resources where they are needed most.
Step 4 – Filter Incidents by Time Period
Apply the Time Period filter to narrow results based on when incidents took place. This is helpful for focusing on the latest activity or reviewing longer-term trends.
Available options:
- Last Hour: For immediate, real-time monitoring.
- Last 24h: Well-suited for daily operations or shift handover reviews.
- Last Week: Best for weekly summaries or reporting purposes.
- All Time: Shows every logged incident since the system was set up.
If you have applied multiple filters and want to start over, click Reset Filters to restore the default view.

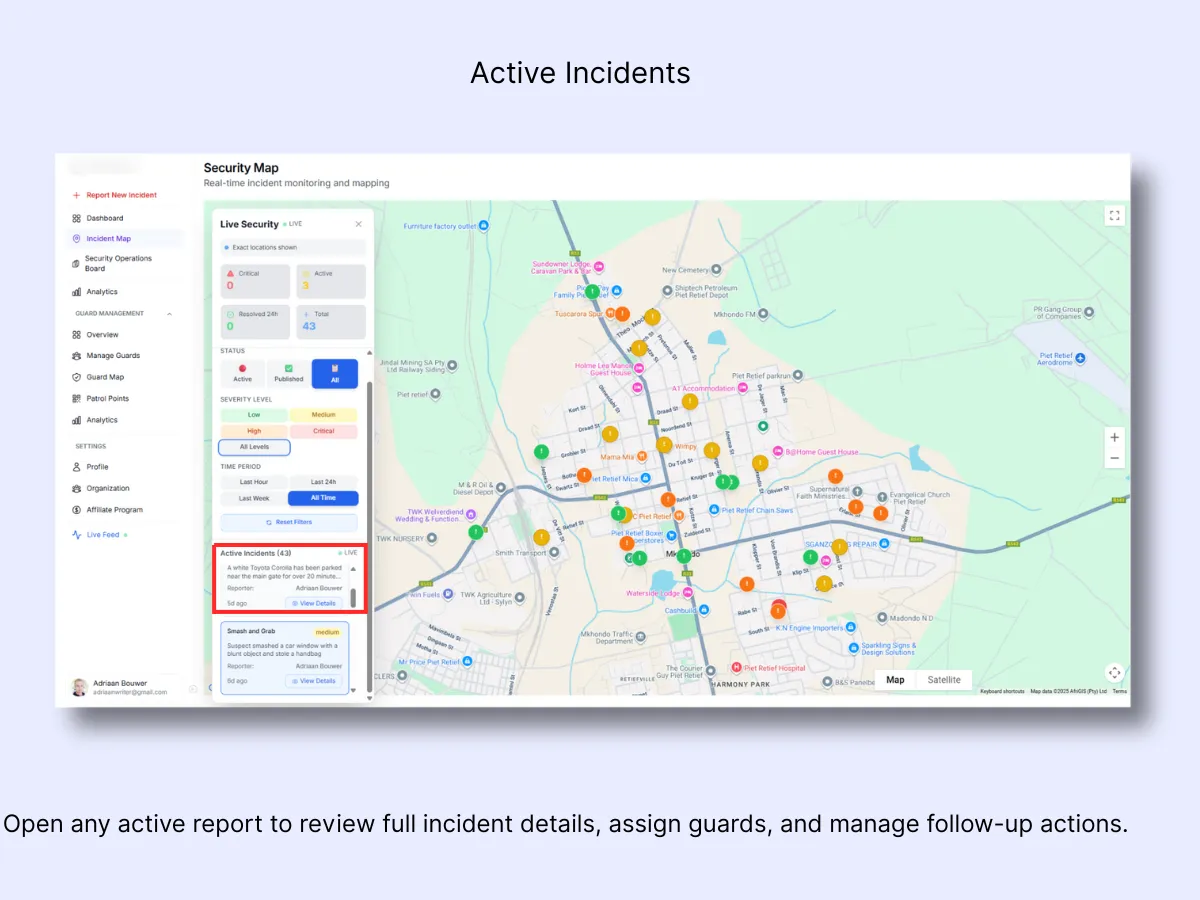
Step 5 – View Active Incident Details
Each card in the Active Incidents list represents a live or recent report. It contains the incident title, severity level, brief description, reporter name, and submission time.
Click View Details to expand the full incident view. This opens the complete report with all available information, including incident type, location, timeline, and guard responses. From here, you can follow updates, assign guards, or publish the incident for client visibility.
This direct access lets admins move straight from overview to action without navigating away from the Incident Map screen.
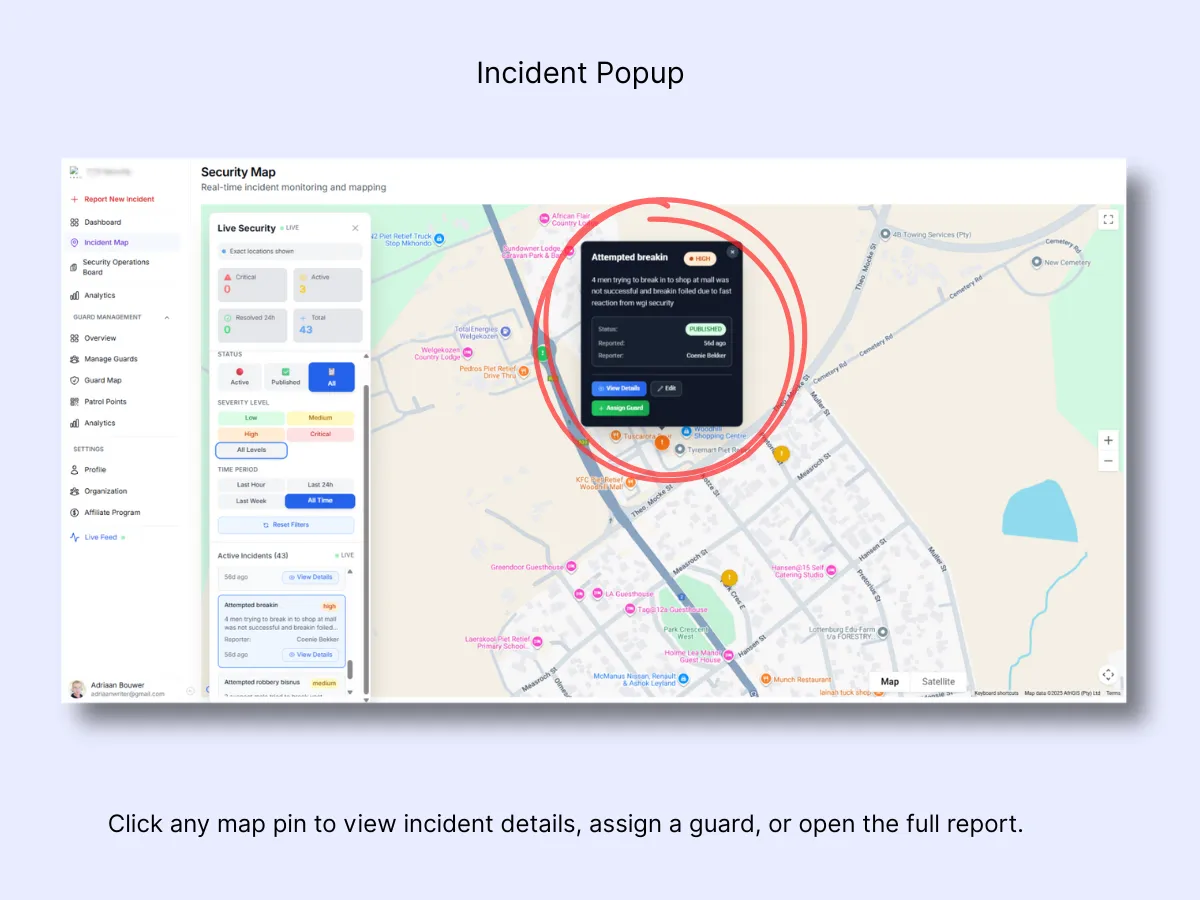
Step 6 – Click an Incident Pin on the Map
Click any colored pin on the map to open a quick-view popup. The popup displays:
- Incident Title and Severity: Assess urgency at a glance using the color tag.
- Description: A brief summary of what occurred.
- Status: Shows whether the case is Active, Published, or Resolved.
- Reporter and Time: Identifies who logged it and when it was filed.
- Action Buttons:
- View Details: Opens the complete incident report with all notes, media, and timeline.
- Edit: Lets admins update the report or correct information.
- Assign Guard: Select and dispatch a guard directly from this popup.
This capability allows admins to take immediate action without changing screens — ideal for rapid triage and on-the-spot guard assignments.
Workflow Example
- A new high-severity incident appears on the map titled "Suspicious vehicle near main gate."
- The admin opens the Incident Map, sets the Status: Active filter, and narrows by High severity.: The map updates to show only active high-level cases. The incident card appears in the Active Incidents list.
- The admin clicks View Details to read the report and confirm the location.
- On the map, guard icons for the nearest available personnel appear around the incident pin.
- The admin assigns the closest guard directly from the map panel.
- Once the situation is resolved, the admin marks the incident as Published to share updates with the client or Resolved for internal record-keeping.
Every action, from filtering to assignment, is recorded automatically, providing a clear audit trail of how the incident was handled from beginning to end.
Related Solutions
- GPS Tracking Software for Security Guards — real-time guard positions alongside incident pins
- Real-Time Incident & Emergency Response — the full incident lifecycle from alert to resolution
- Control Room Dashboard — one live screen for your entire operation