
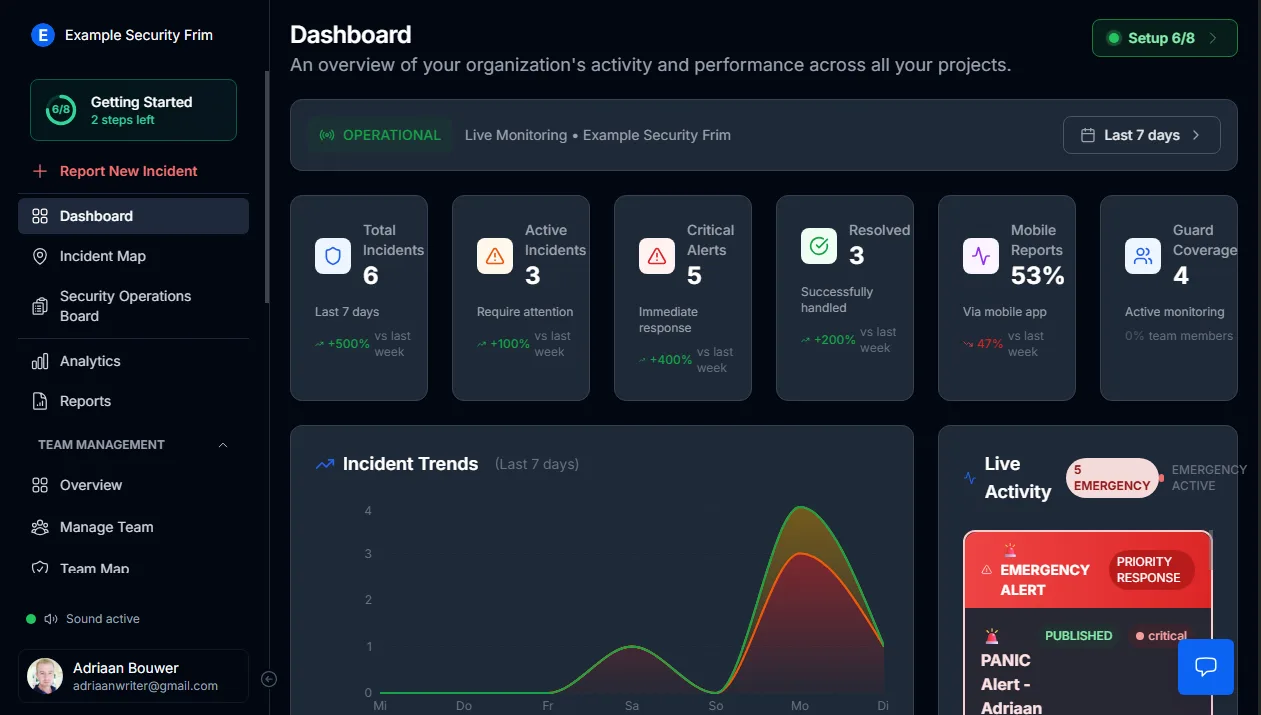
Your entire operation on a single screen
Stop switching between tabs, radios, and phone calls. The moment this dashboard loads, you have:
- Every open incident and its current status
- Alerts demanding immediate response
- Guard positions and shift assignments
- Operational health of the full system
This is the screen that stays open for the duration of every shift.
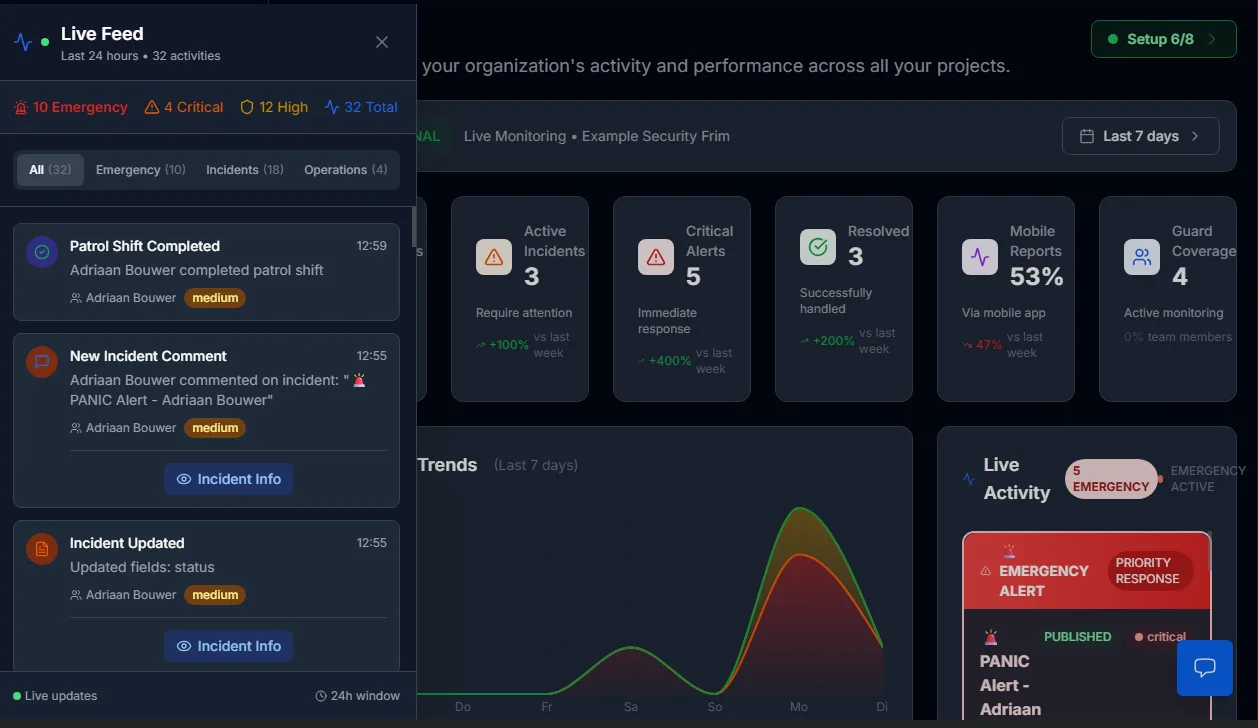
Events appear as they happen
Panic buttons, new reports, status changes — every field event streams into the dashboard instantly through the real-time incident and emergency response pipeline.
What that eliminates:
- Delays from callbacks and relayed messages
- Blind spots between the field and operations
- Events lost during peak activity hours
When something occurs on site, your control room already knows.
Verified guard positions at all times
Integrated guard coverage and availability management feeds directly into the command view, giving you:
- Confirmed on-duty personnel
- Current locations for every active guard
- Proximity data for rapid dispatch
Deployment decisions are driven by live data — not assumptions, not radio polls.
Spatial awareness through live mapping
Every guard and every incident sits on a live map powered by GPS tracking software for security guards.
Your operators work with geography, not text descriptions:
- Pinpointed incident locations across all sites
- Visual priority indicators for severity levels
- Clear separation between active and resolved events
Spatial context turns reactive operators into proactive coordinators.
Operational health at a glance
The dashboard surfaces system diagnostics so you never operate blind:
- Platform connectivity and uptime status
- Mobile reporting pipeline confirmation
- Incident resolution flow verification
Silent outages and hidden failures are eliminated before they cost you.
What this replaces
Control rooms used to run on:
- Radio traffic and shouted updates
- WhatsApp groups with conflicting messages
- Paper logs filled in after the fact
Now they run on:
- A single, always-current operational view
- Shared situational awareness across every operator
- Verified, timestamped data backing every decision
Maintain command. Especially when multiple situations unfold simultaneously.
Learn how to use the dashboard
Step-by-step instructions are available in our admin documentation:
- Dashboard Tab Guide — live activity, incident cards, and admin workflow
- Live Feed Guide — real-time event stream for control room operators
- Security Operations Board — manage incidents through Urgent, Active, Review, and Resolved stages
Get Started
MyProtektor works on any Android or iOS smartphone. No special hardware needed.
View pricing plans to find the right package for your team.


